The sourcing strategy of e-motors and system integration is heavily tilted toward in-house production with many original equipment manufacturers investing in plants/production lines for in-house manufacturing.
In our recent insight titled “The battle for e-drive supremacy: Make vs. Buy,” we discussed how the majority of OEMs are opting to in-source e-drive components, mostly e-motors and overall eAxle system integration, owing to a variety of reasons:
- Obtain competitive advantage: For electric vehicle makers, range and efficiency are the key differentiators as potential customers seek EVs that provide a higher range and faster charging. Electric drive components such as e-motors and inverters play a vital role in improving EVs’ range and efficiency owing to which automakers view electric drive units as a source of competitive advantage.
- Cost reduction and improvement in product development time: In-house manufacturing helps automakers to optimize costs associated with the development of EVs and brings in efficiencies to achieve reduced product development time. As EV production volume grows, the automakers with higher vertical integration will achieve significant cost advantage.
- Continued research and development (R&D) on e-motor technology: Until now, and as EVs continue to evolve, there still is no fixed rule on the type of e-motors used in EVs. Automakers continue to experiment with different types and topologies of e-motors to find the perfect fusion of not only increased efficiency but also reduced cost and size. Also, with the existing challenges related to the sourcing of rare earth elements and their sustainability, automakers continue to look for e-motors that are made without permanent magnets.
- Avoid uncertainties in the supply chain: The onset of the COVID-19 pandemic and the ongoing Russia-Ukraine conflict have revealed the fragility of the supply chains and the subsequent disruption. This is also one of the reasons why automakers want to bring manufacturing of major EV components in-house.
- Repurpose existing internal combustion engine (ICE) factories and prevent job losses: As automakers gear up to slowly phase out ICE vehicles and shift to EVs, job losses and closures of ICE factories are a looming threat. By in-sourcing e-drives and e-drive components, OEMs have the opportunity to uphold their social contract by leveraging their existing workforce to repurpose ICE factories.
In this article, we will take a further deep dive into the sourcing strategies of e-drive components and system integration by OEMs. Please note that all e-drive components mentioned in this insight are limited to battery-electric vehicles (BEVs) and fuel-cell electric vehicles (FCEVs).
Different types of sourcing strategy
Upon closely analyzing the sourcing strategies of various OEMs and tier 1s suppliers it is clear that the sourcing strategy of e-drive components is not strictly limited to mere in-house and outsourced categories. For a better understanding, S&P Global Mobility analysts have further categorized and sub-categorized the sourcing strategies as follows.

Sourcing trends of e-drive components
- E-motors
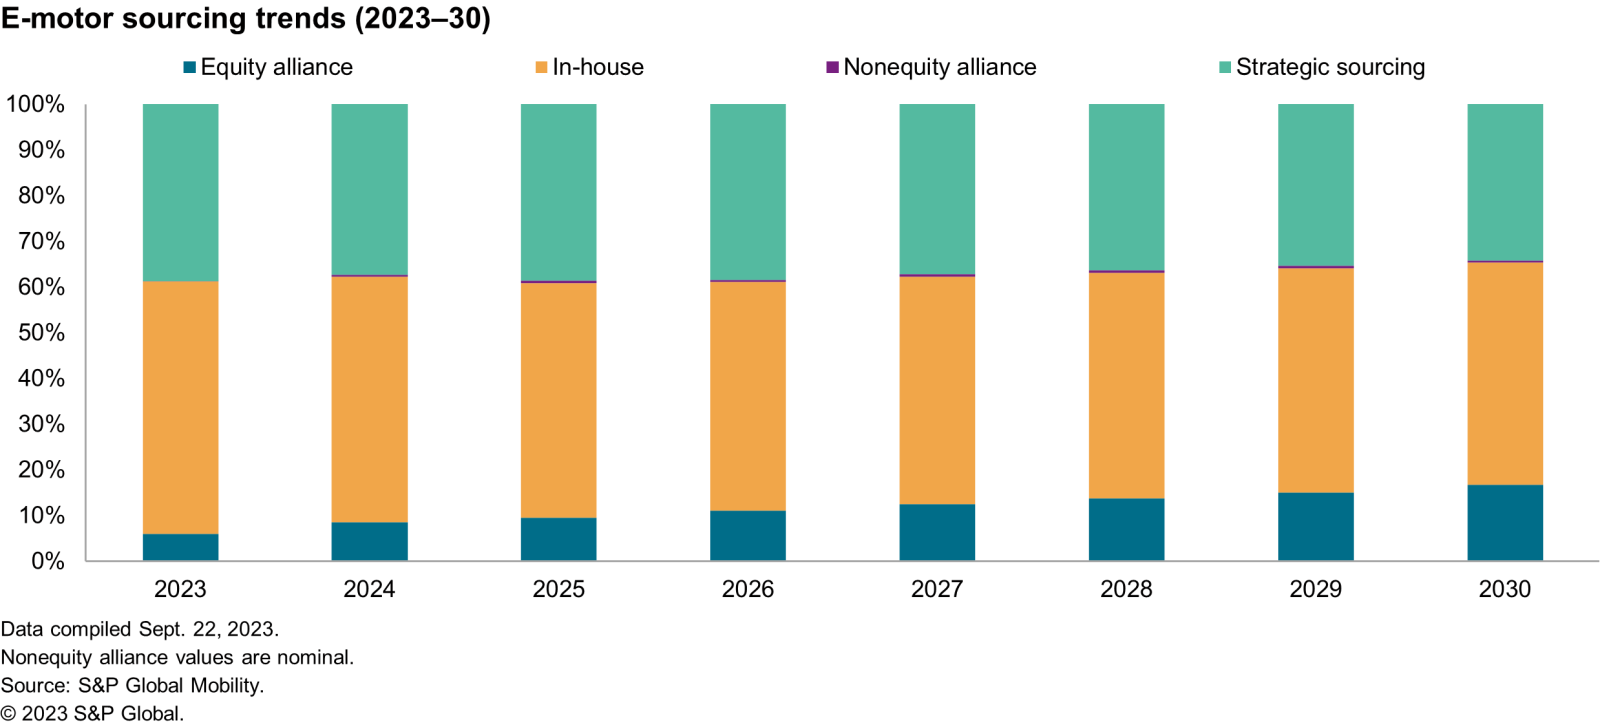
In-house production is the most preferred option for OEMs, with many companies announcing investments/factory expansion for in-house e-drive component production. For example, in February 2023, General Motors (GM) announced its investment in its powertrain plant (which currently manufactures ICEs and transmissions for various GM car and pickup models) in Ontario to produce 400,0000 units of e-drives per annum. In addition, GM stated in September 2022 that it would invest $760 million in its Toledo Propulsion Systems factory to prepare it to manufacture drive units for future GM EVs. Similarly, Mercedes-Benz intends to double the e-drive production capacity of its Untertürkheim, Germany, plant starting in 2024 that will result in production of 1 million e-drive units for vehicles on the Mercedes Modular Architecture (MMA) platform. Mercedes-Benz is developing the electric propulsion unit for the future models in-house. Automakers such as Hyundai (with 97% in-house production of e-motors) and Renault-Nissan-Mitsubishi (with 85% in-house production of e-motors) are also progressively in-sourcing more e-motors.

According to the S&P Global Mobility forecast, the in-house sourcing strategy dominates the global e-motor market with 55% market share while outsourcing (strategic sourcing) comprises 39% of the market. As of 2023, Tesla, BYD, Nissan, Volkswagen and Hyundai dominate the e-motor market by comprising 43% of the global e-motor market.
By 2030, the in-house sourcing strategy will continue to dominate the market with almost 50% market share while equity alliances will witness an increase i.e., equity alliances will comprise 17% of total global e-motor sourcing market.
- Inverters
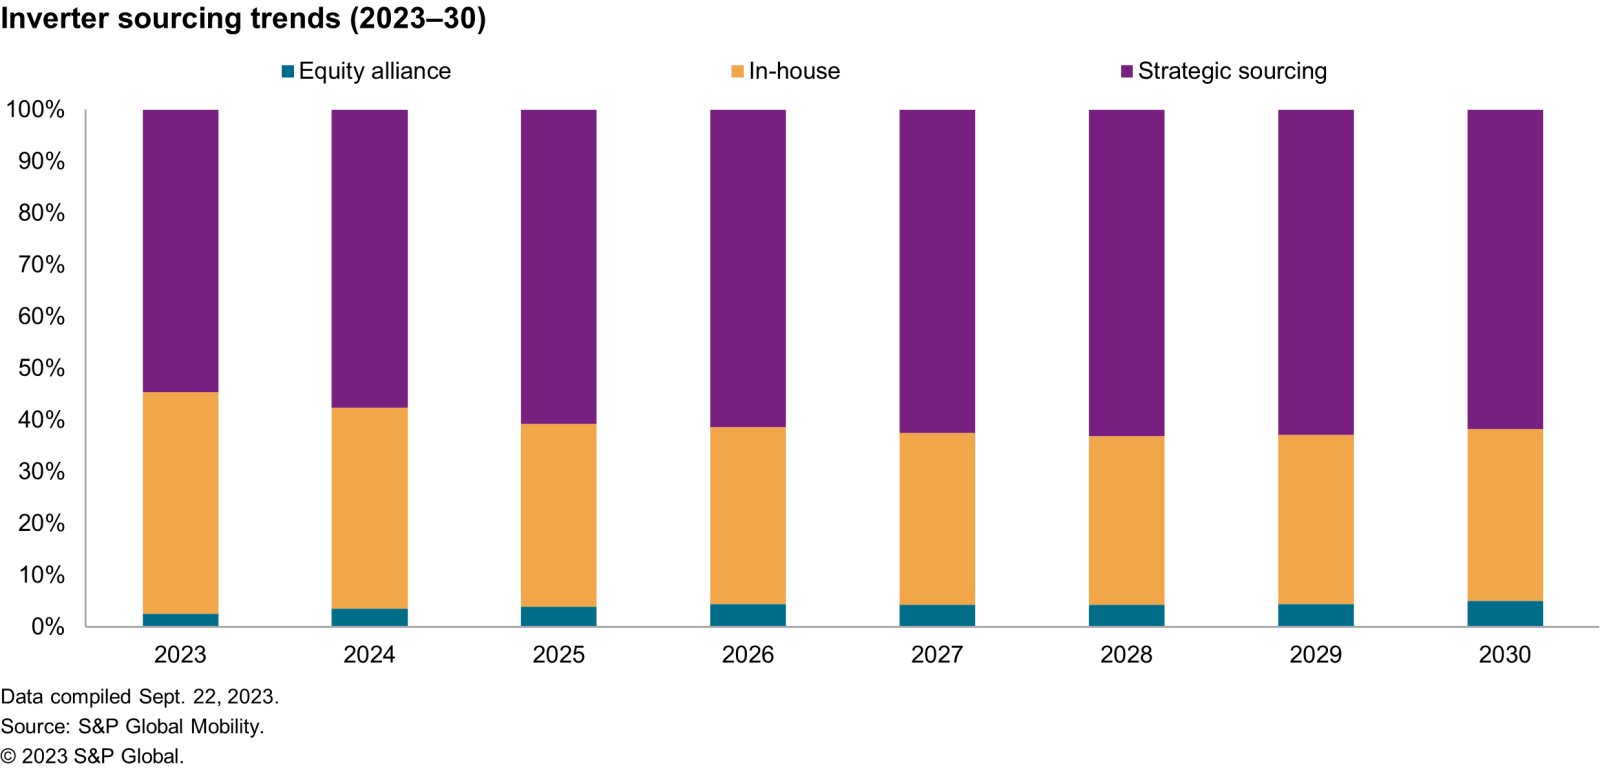
In the case of inverters, the overall sourcing trend will likely tilt toward strategic sourcing throughout the 2023-30 forecast period. As of 2023, in-house sourcing of inverters comprises 43% while outsourcing accounts for 55% of the total global inverter sourcing market. OEMs such as Tesla and BYD lead the in-house production of inverters. Recently, Volkswagen during its Tech Day, announced that in addition to developing batteries and e-motors, the company will also develop pulse inverters and thermal management systems in-house.
However, the trend of outsourcing is expected to witness an increase i.e. — in 2030, we expect outsourcing (strategic sourcing) to dominate the global inverter market with 62% market share. One of the key reasons for the increase in OEMs outsourcing inverters is the lack of domain/technical expertise needed to design and develop inverters.

Another ongoing trend that seems to be gaining momentum in context of inverter sourcing is the long-term partnership of OEMs with silicon carbide (SiC) suppliers/SiC chips suppliers. Some notable partnerships are mentioned below.
- Stellantis and Infineon: In November 2022, Stellantis signed a nonbinding memorandum of understanding (MoU) with Infineon under which Infineon will reserve manufacturing capacity and supply CoolSiCTM "bare die" chips to Stellantis' direct tier 1 suppliers beginning in the second part of the decade. The potential sourcing volume and capacity reserve are worth far more than €1 billion.
- Jaguar Land Rover (JLR) and Wolfspeed: Similarly, in October 2022, JLR entered into a strategic partnership with Wolfspeed to source SiC semiconductors for its next-generation EVs with the intent to increase powertrain efficiency and driving range. As part of the partnership, Wolfspeed will also ensure SiC supply for JLR’s future EV production needs.
- Mercedes-Benz, Wolfspeed and Onsemi: As part of a strategic collaboration, Mercedes-Benz has adopted Onsemi's silicon carbide (SiC) technology for its traction inverters equipped in VISION EQXX. In January 2023, Wolfspeed announced that it will supply SiC semiconductors that will be equipped in next-generation powertrain systems of various Mercedes-Benz vehicle lines.
- BMW with Onsemi: In March 2023, BMW entered into a long-term supply agreement with Onsemi for its EliteSiC technology that will be used in BMW's electric drivetrains for the 400 V DC bus.
- System integration
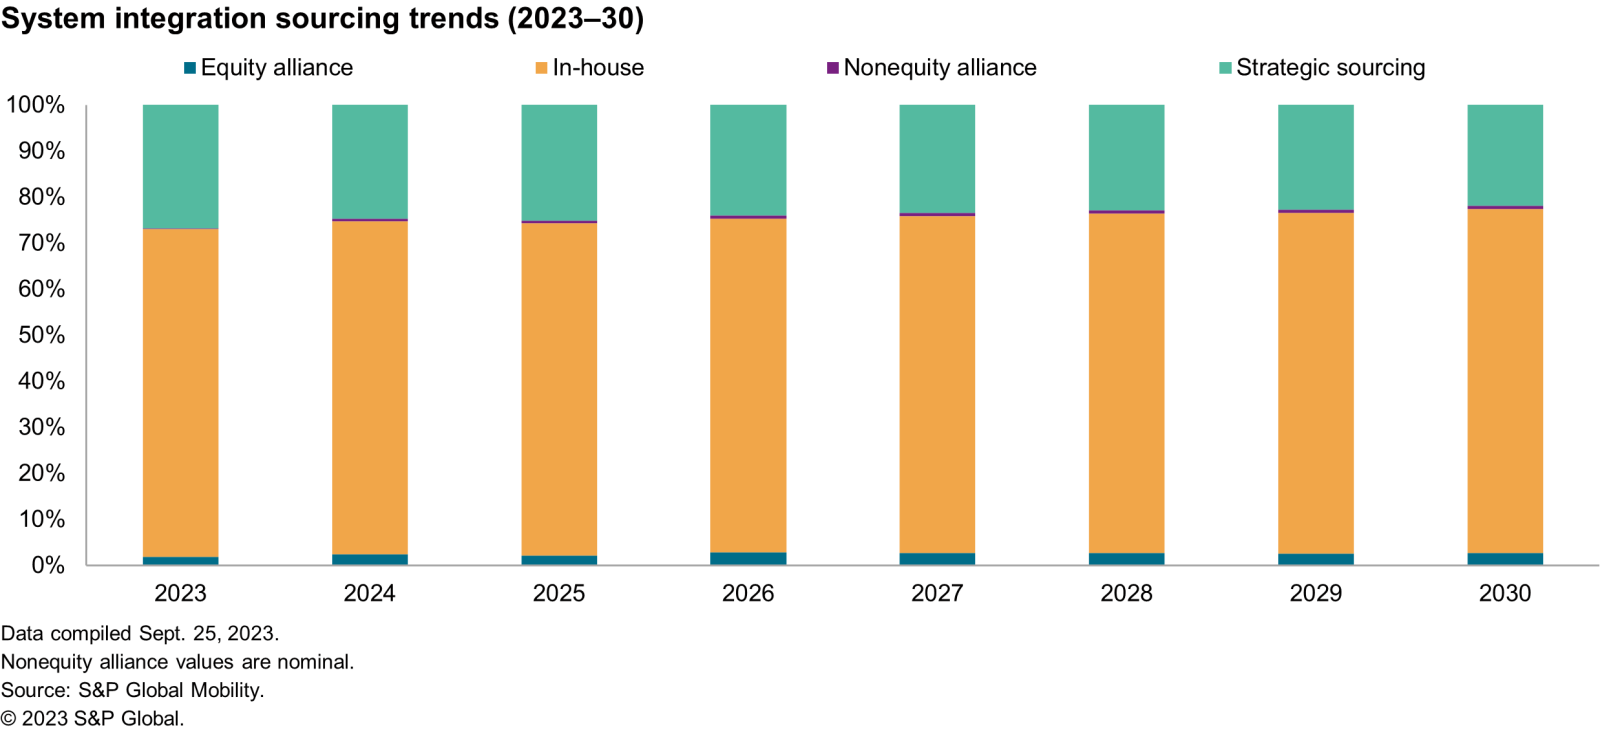
OEMs account for a significant share in the system integration market. As per S&P Global Mobility forecasts, currently, almost 71% of system integration is in-house, and strategic sourcing accounts for only 27%. As per our forecasts, the in-house production trend in e-drive system integration will likely continue throughout the 2023–30 forecast period. When it comes to in-house system integration, Tesla, BYD, Nissan, Volkswagen and Hyundai are leading the market.

In conclusion, in-house production is the ongoing trend in the case of e-motors and system integration among most OEMs. However, OEMs are unlikely to entirely in-source e-drives or its components. Various key metrics such as profitability, cost reduction, product development time, resource availability and localization factors will always influence the sourcing decision. For example, BorgWarner recently announced a series of wins wherein it will supply e-motor stators and inverters to a major East Asian OEM starting in 2025. It will also supply integrated drive modules to Li Auto for its new-energy vehicles.
Furthermore, as EVs continue to become mainstream, the volumes of e-motor production will increase, and the sourcing of motor subcomponents such as rotors and stators will likely be individually outsourced. This will also provide enough opportunities for tier 1 and tier 2 suppliers to expand further and tap into the motor subcomponents market. Tier 1 and tier 2 suppliers will have the opportunity to supply individual rotor and stator components to OEMs.